

Project dashboard
The dashboard sums up all your work in one screen. It shows how many tasks exist, how many hours were spent, where tasks sit and who does most of the work. You filter it to look at one project, one person or one period.
In simple words: Pick filters, then read five widgets.
Open Dashboard → Project.
Before you start
Hours need Enable Timesheets and logged time. See Timesheets. You need permission to open the page.
Filters
- Open
Dashboard → Project. - Use the filters at the top of the page.
- Choose values. The widgets update at once.
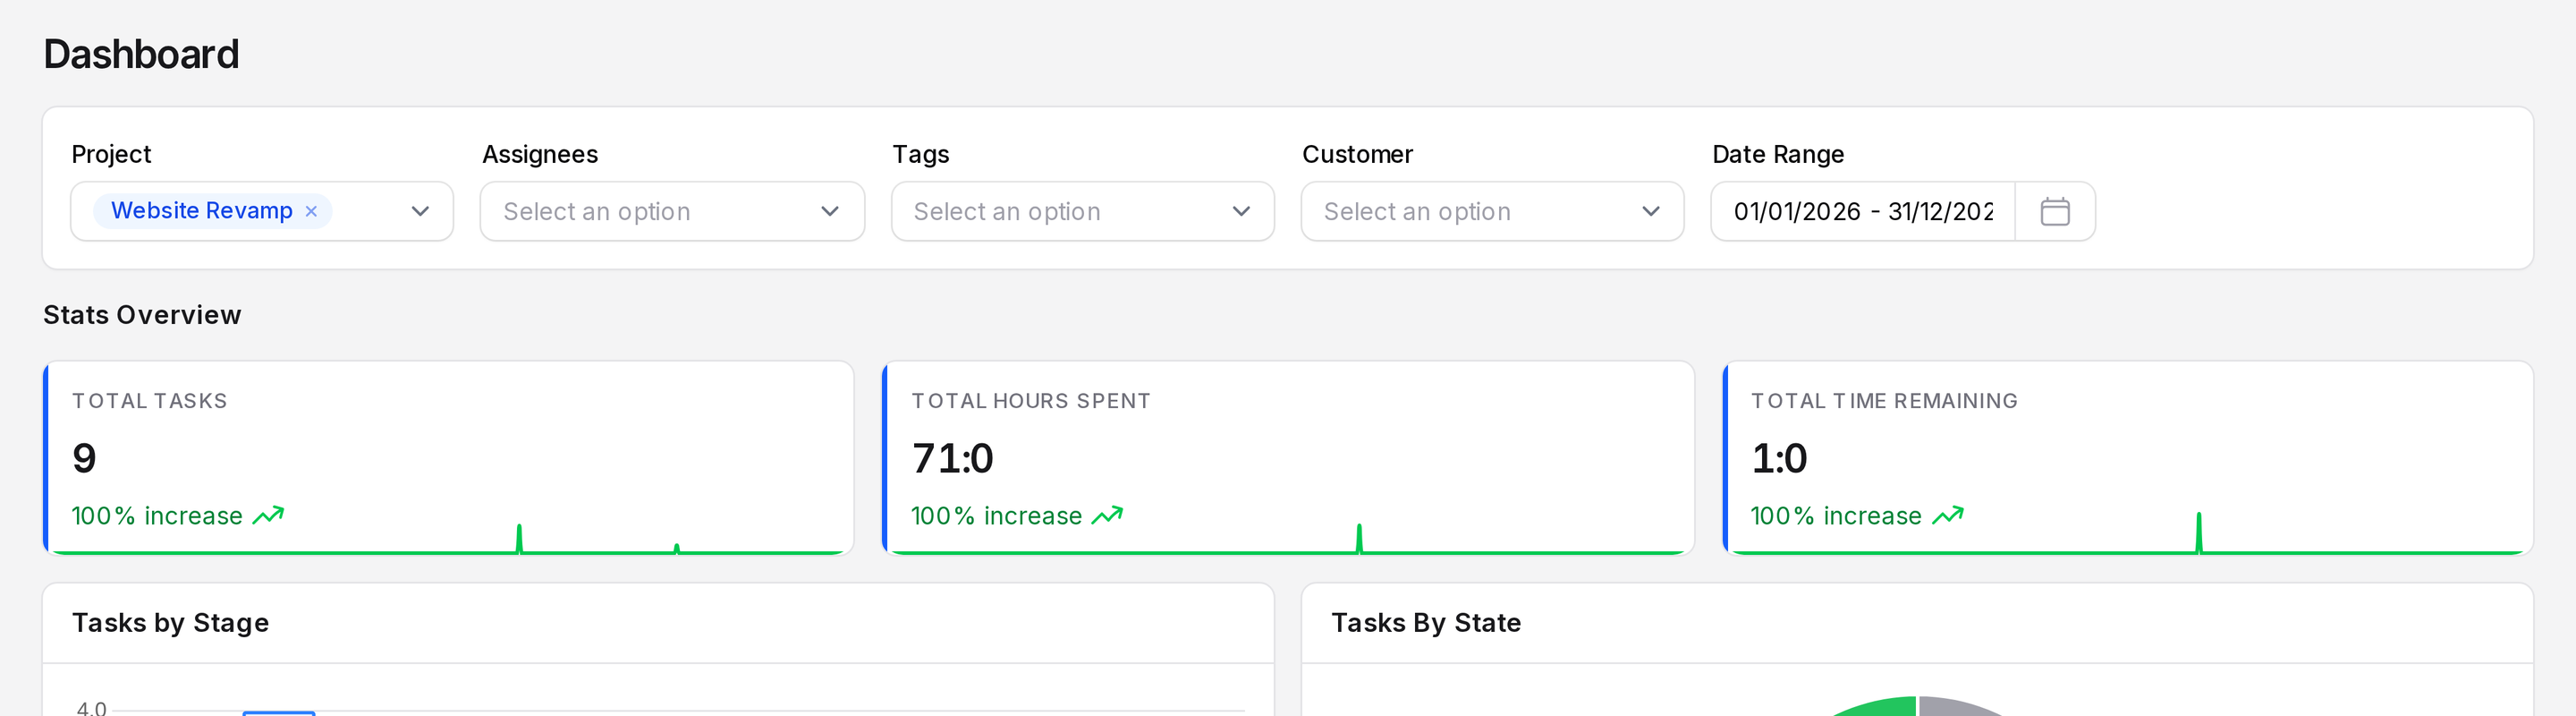
- Project: Show one project only. Example: Website Revamp.
- Assignees: Show tasks of chosen people.
- Tags: Show tasks with chosen tags.
- Customer: Show the work for one customer.
- Date Range: A start and an end date.
Leave a filter empty to include everything.
Widgets
Stats overview
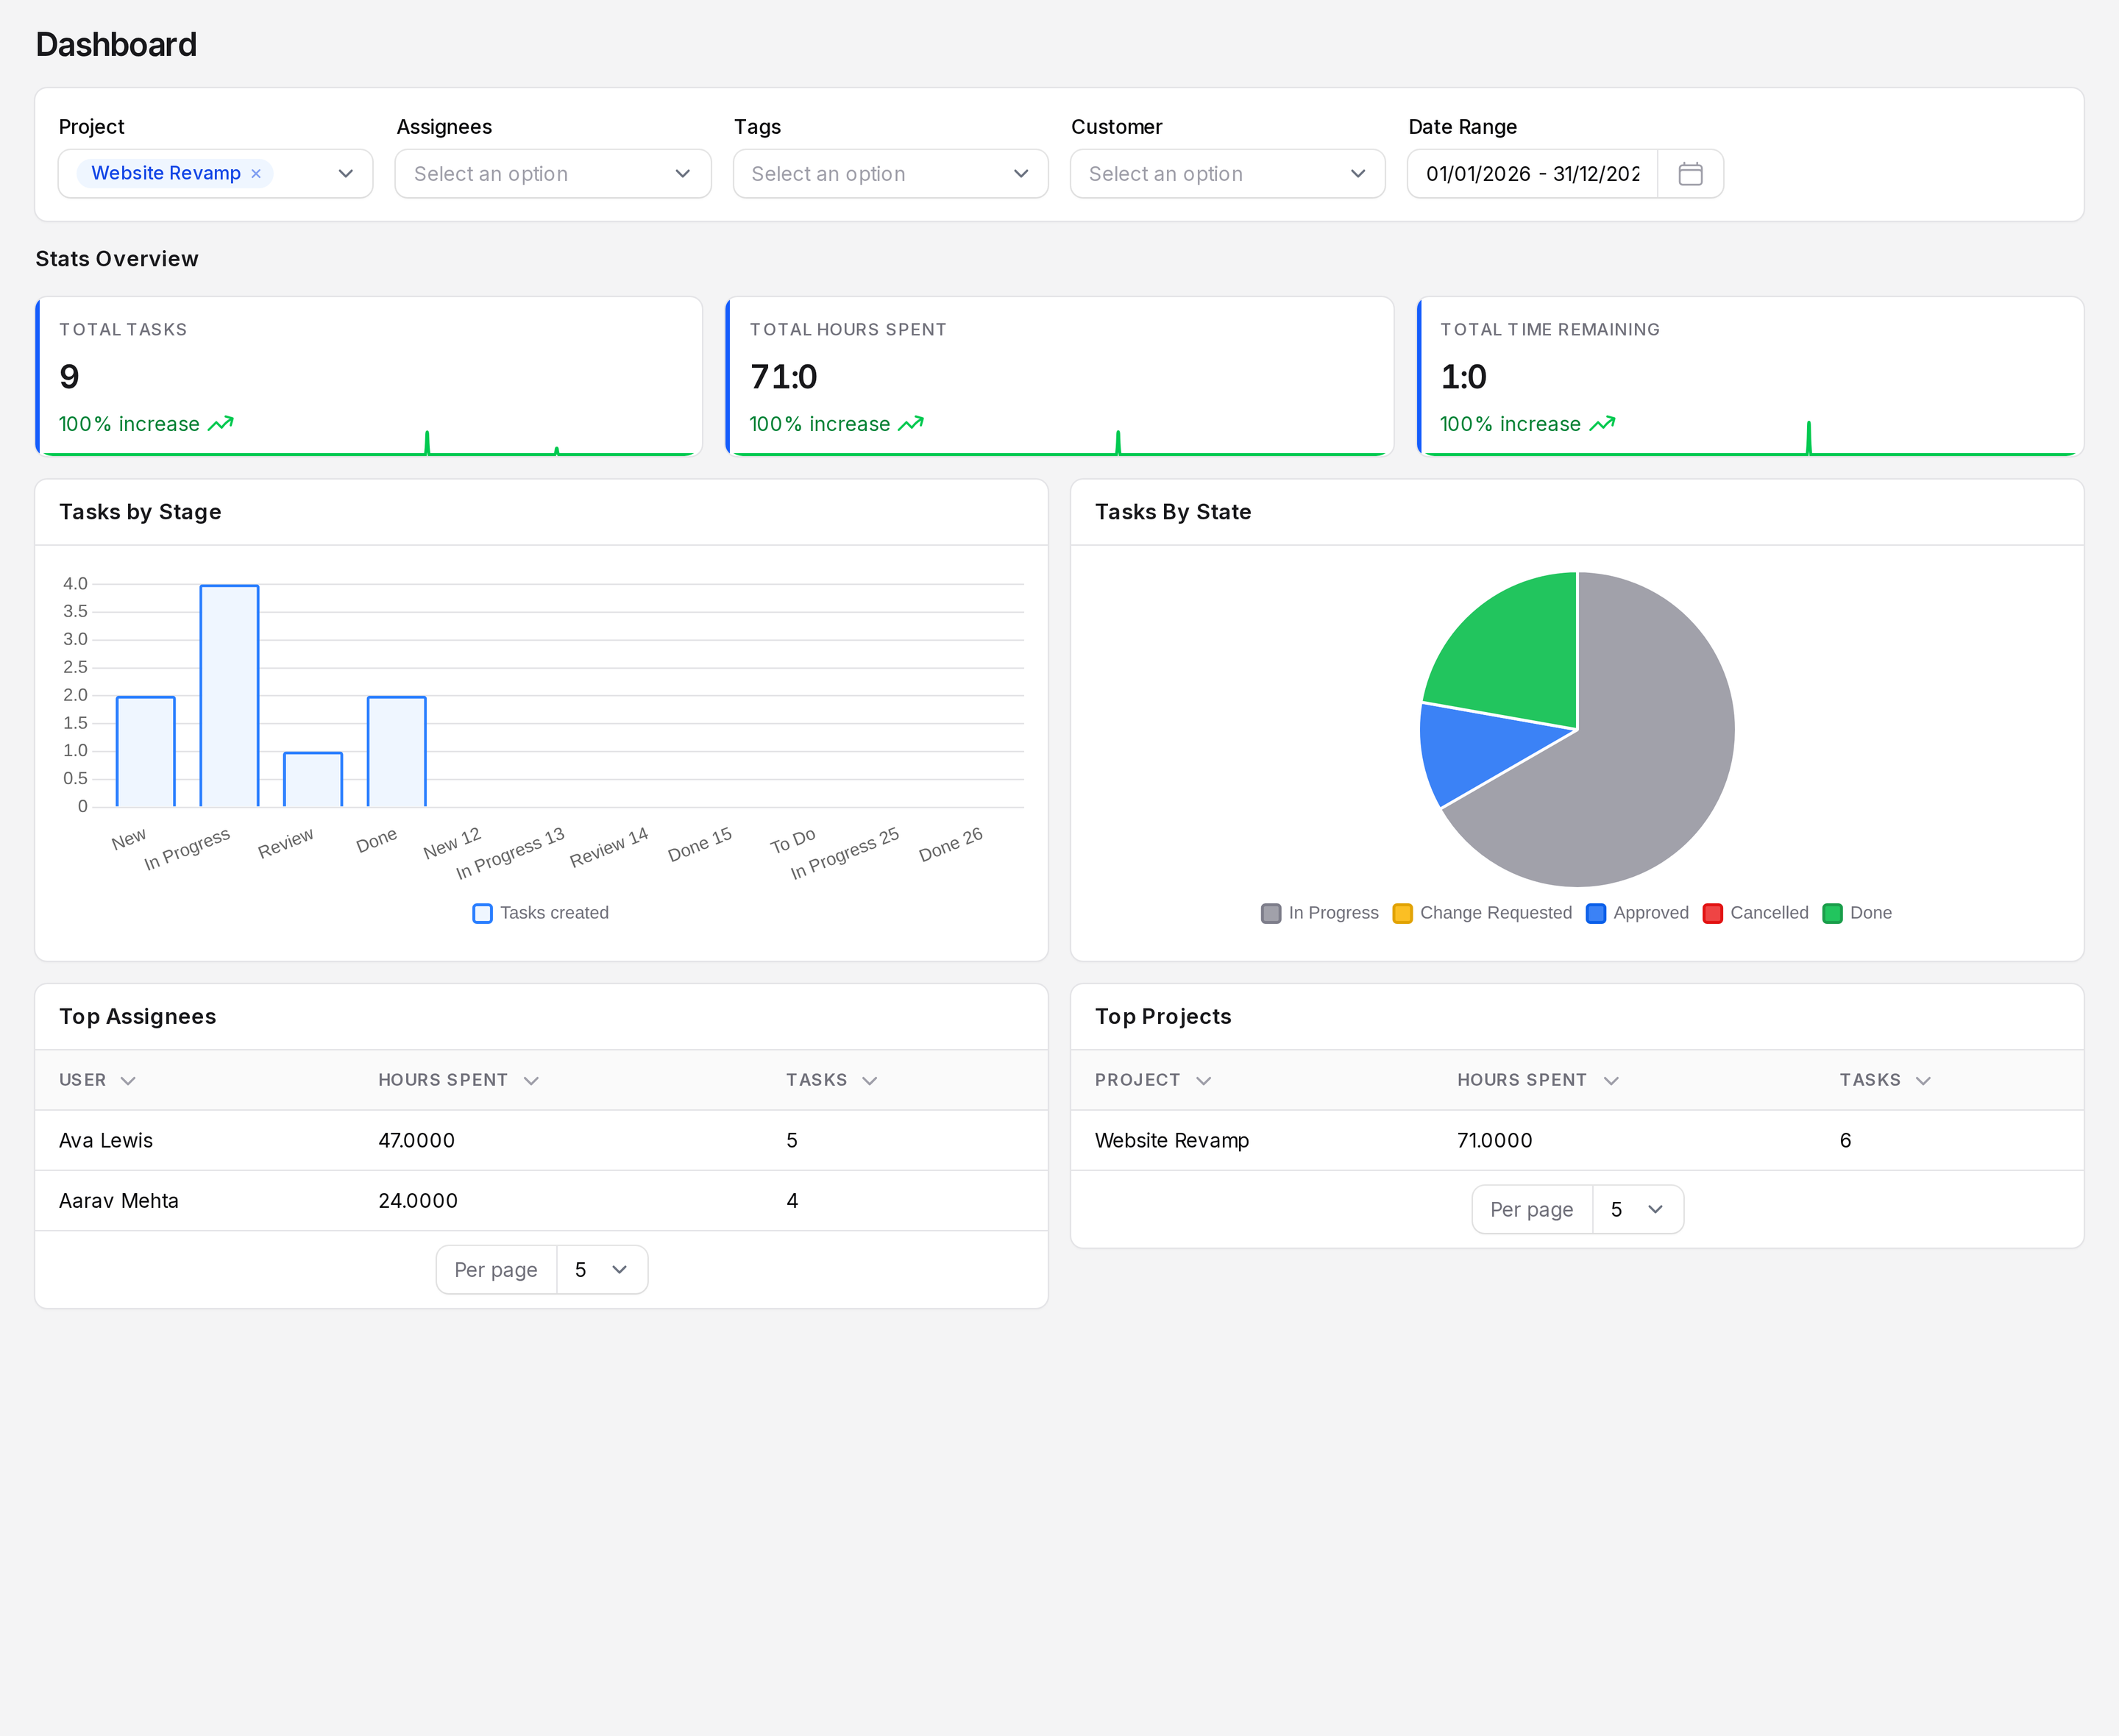
Three numbers sit at the top.
- Total Tasks: how many tasks match.
- Total Hours Spent: logged time.
- Total Time Remaining: allocated time not yet used.
Each number shows a percent change against the previous period. The numbers refresh by themselves every 15 seconds.
Tasks by stage
A chart of tasks created in each stage, such as New or Review.
Tasks by state
A chart of tasks per State: In Progress, Change Requested, Approved, Cancelled and Done.
Top assignees
A table with User, Hours Spent and Tasks. It shows who logged the most time. In the example, Ava Lewis and Aarav Mehta appear here.
Top projects
A table with Project, Hours Spent and Tasks. It shows which projects use the most time.
Where else to see totals
The same stats row appears at the top of the task list. See Task list, views and filters.
TIP
Set a Date Range to focus on one period. The stats row then shows the change against the period before.