

Forecast
The forecast puts your opportunities on a board with one column per month. Each column shows how many deals you plan to close that month and the revenue you can realistically expect from them. You use it to plan ahead and to spot months with too few deals.
In simple words: The forecast is a month-by-month board of the money you expect to win. You can drag a deal to another month.
Open CRM → Reporting → Forecast.
The forecast board
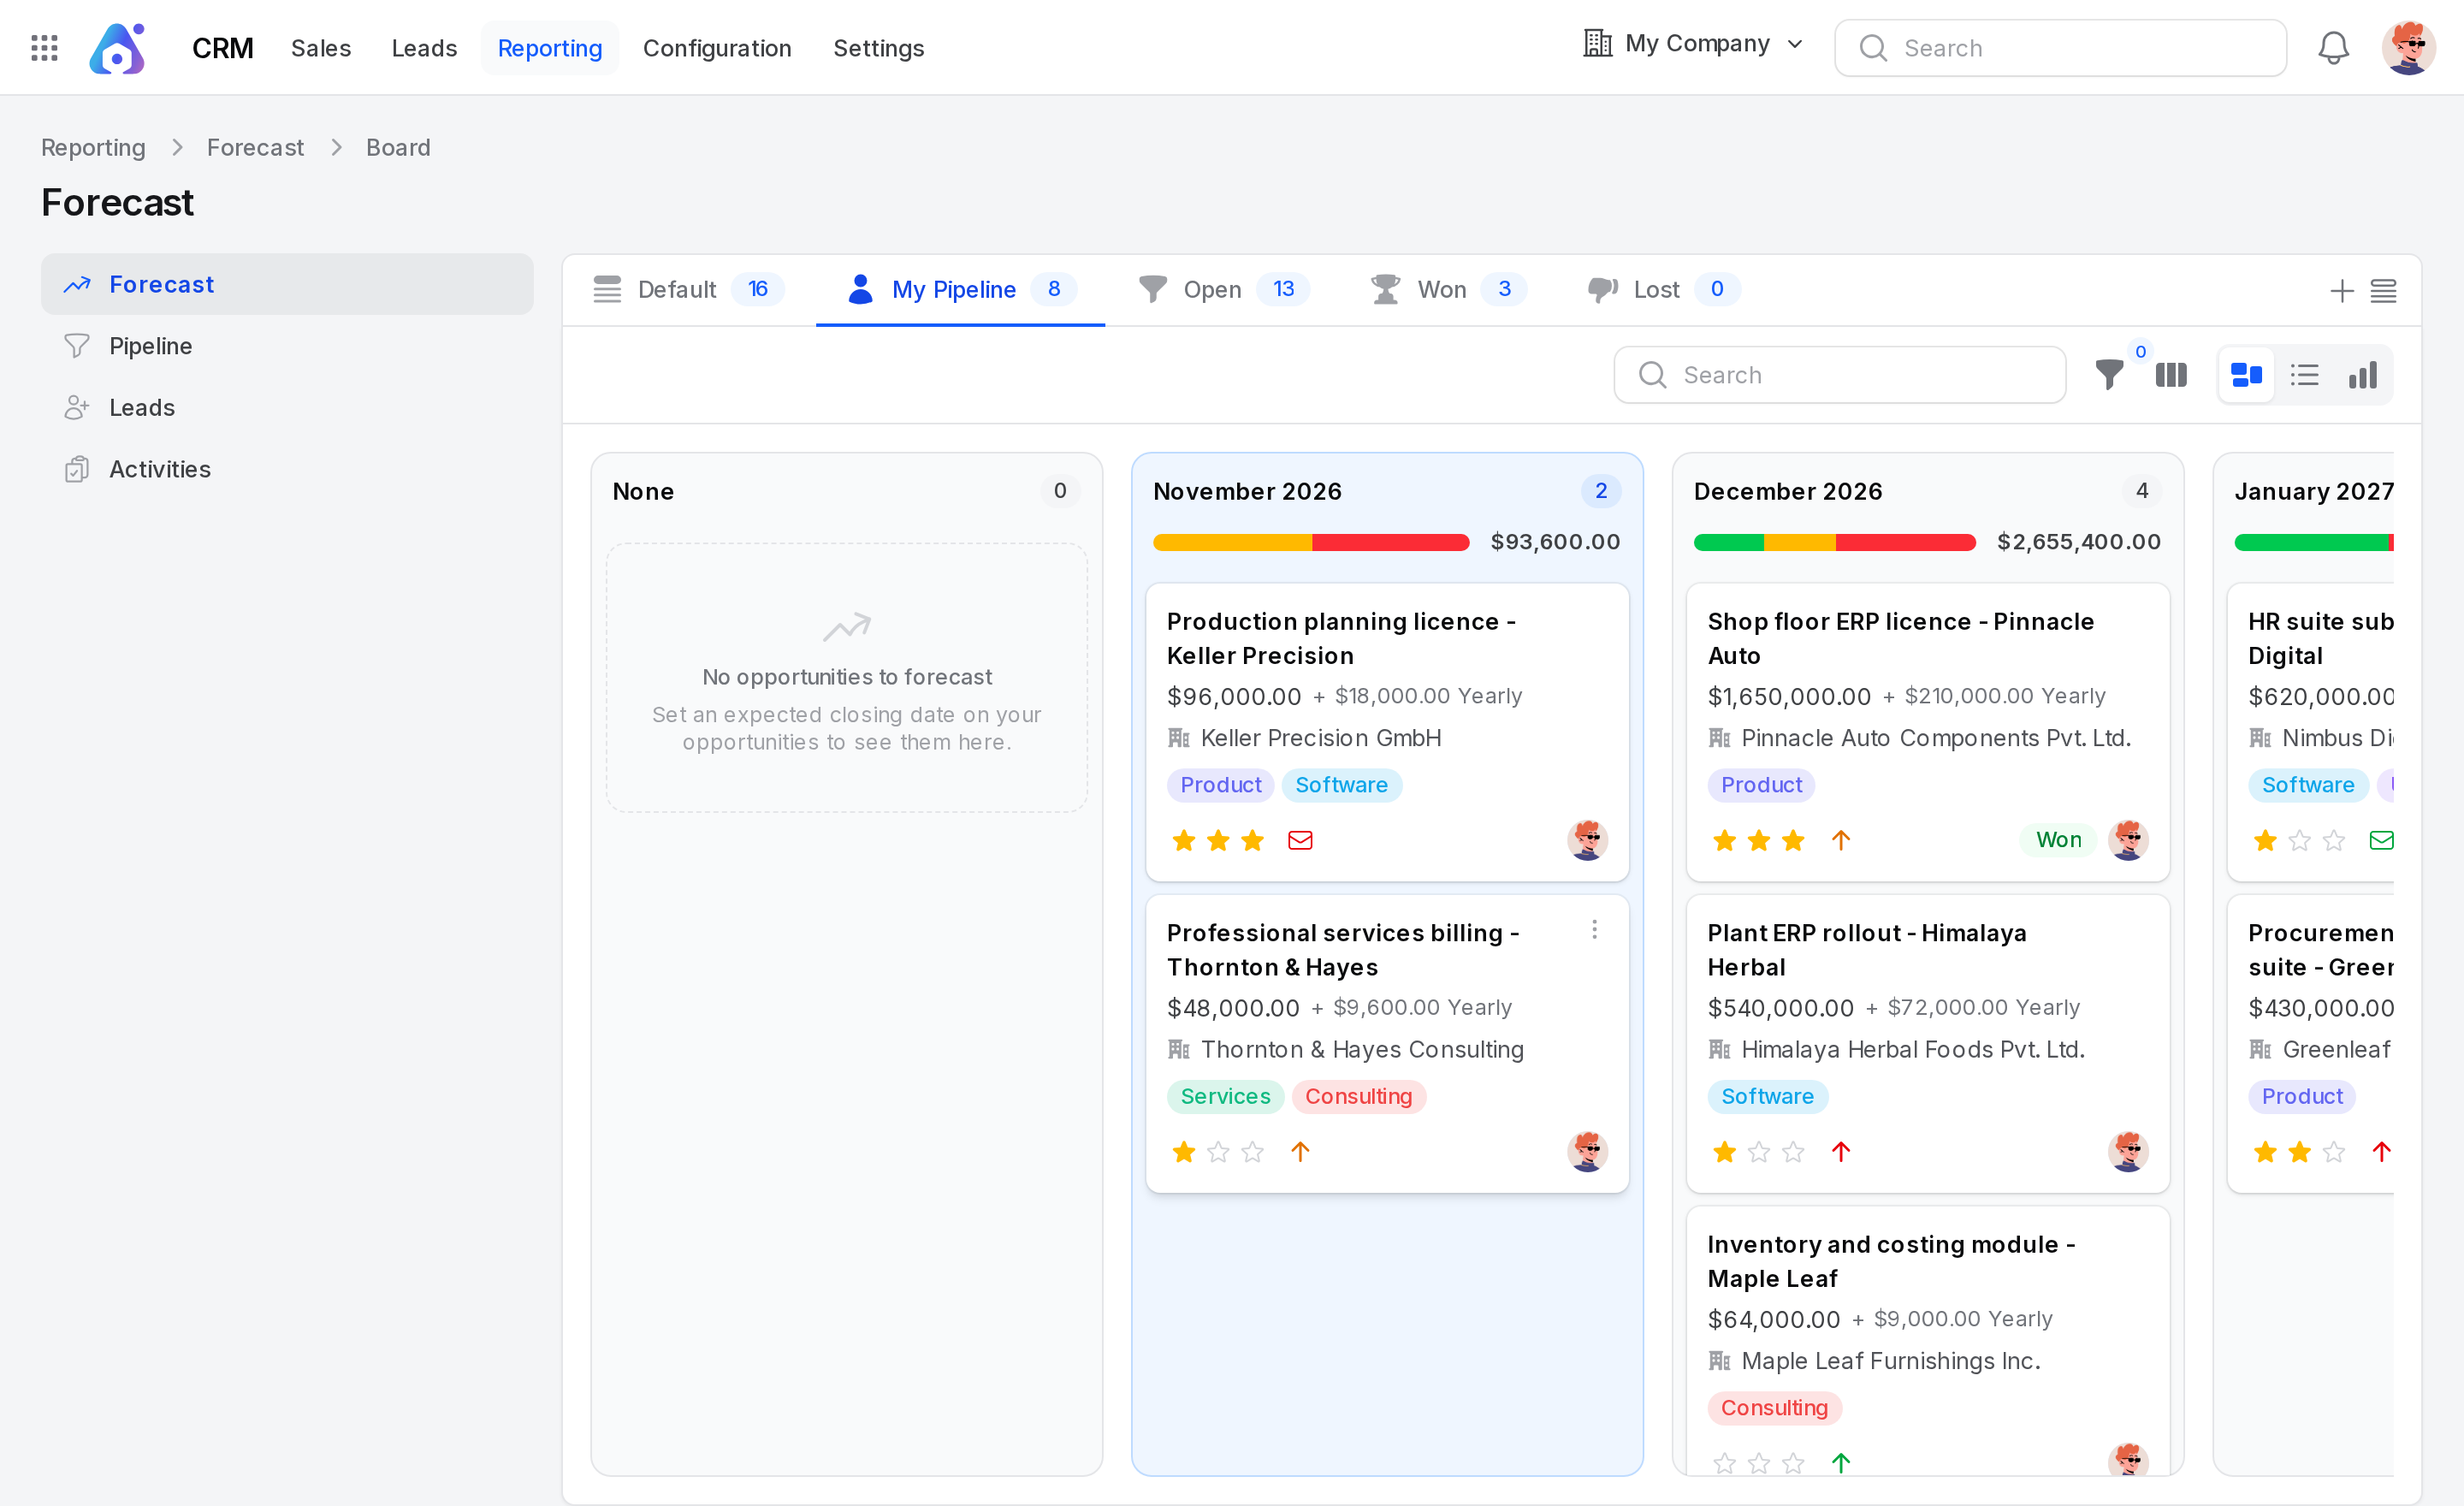
The board opens in the Board view. The page also offers List and Graph (see below).
Columns
- None: Opportunities that have no Expected Closing date.
- Current month: Highlighted. It always shows.
- Next three months: Always shown, even when empty.
- Later months: A column appears for every month that has at least one deal.
Months before the current month are not shown. Deals with an older closing date are left out of the board.
Example: Today is 3 November 2026. The board shows None, November 2026, December 2026, January 2027 and February 2027. February is empty and shows "No opportunities to forecast".
Column header
Each header shows the month, the number of deals, and an amount. The amount is the prorated revenue of the column. That is expected revenue times probability for each deal, added together. It is not the full deal value.
Example: November 2026 shows 2 deals and $93,600.00. The two deals are worth $96,000 at 70% and $48,000 at 55%. That gives 67,200 plus 26,400, which is 93,600.
Cards
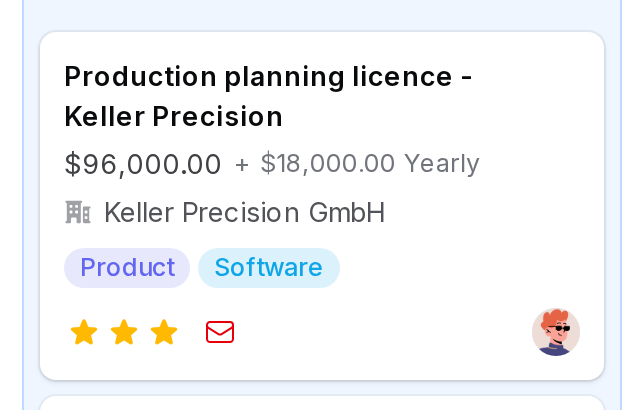
Each card shows:
- The opportunity name.
- The Expected Revenue, and below it the recurring revenue with its plan, for example
+ $18,000.00 Yearly. - The customer.
- The tags, in their colours.
Click a card to open the opportunity.
Move a deal to another month
- Drag a card from one column to another.
- Drop it. A message says Expected closing date updated.
The deal's Expected Closing becomes the last day of the new month. Dropping it in None clears the date. You need permission to edit the opportunity, or a red message tells you that you are not allowed to change it.
Views
Use the view switch to change how you see the same data.
| View | Use it to |
|---|---|
| Board | Move deals between months. |
| List | Read rows and totals, and select rows for bulk actions. |
| Graph | See a bar chart. The default is Prorated Revenue by Expected Closing. |
Tabs
The tabs above the board are the same as in the pipeline: Default, My Pipeline, Open, Won and Lost. Open the tab menu for Unassigned.
- My Pipeline: Opportunities where you are the salesperson.
- Open: Opportunities that are not in a won stage.
- Won: Opportunities in a won stage.
- Lost: Opportunities you marked as lost.
Columns in the list view
Name, Type, Customer, Stage, Expected Revenue, Probability, Salesperson, Sales Team, Expected Closing, Created On and Closed On. The column toggle adds Lost Reason, Country and City. An extra column shows the measure you chose.
Search, filter, group and export
- Type in the search box to find an opportunity by name or customer.
- Use the Salespeople and Sales Teams filters to look at one person or team.
- Use the filter builder for rules on Salesperson, Active, Won, Closed Date and similar fields.
- Use Group by in the list or graph. The choices are Salesperson, Sales Team, Stage, City, Country, Lost Reason, Company, Campaign, Medium, Source, Expected Closing, Creation Date, Conversion Date and Closed Date.
- Select rows in the list and use the bulk actions to export, delete, restore, mark as lost, merge, or send email or SMS.
See Search, filter and group records.
Read the forecast
- Open
CRM → Reporting → Forecast. - Look at the header of each month. Compare the deal count and the amount.
- Open a card that looks too large or too small and check its Probability.
- Drag deals whose date is wrong to the correct month.
TIP
Review the board every week. Move a deal as soon as the customer changes the date.
Behind the scenes
- The board reads opportunities only. Leads do not appear until you convert them.
- A deal sits in the month of its Expected Closing date. Without a date, it sits in None.
- Dragging a card changes the opportunity itself. The pipeline, Pipeline analysis and Lead analysis show the new date too.
- The amount uses the Probability saved on each opportunity. See Lead scoring for how it is set.