

Orders report
The Orders report counts your settled orders and groups them by day, week or month. For each group it shows the untaxed amount, the taxes, the total and the margin. Use it to see how your sales move over time and to spot slow or busy periods.
In simple words: This report answers "how many orders did I take, and how much did they bring in, per day, week or month?"
Open the report
Go to Point of Sale → Reporting → Orders. The page title is Order Analysis. You can also reach it from the three-dot menu of a register card, under Reporting → Orders. That link opens the report already filtered for that register.
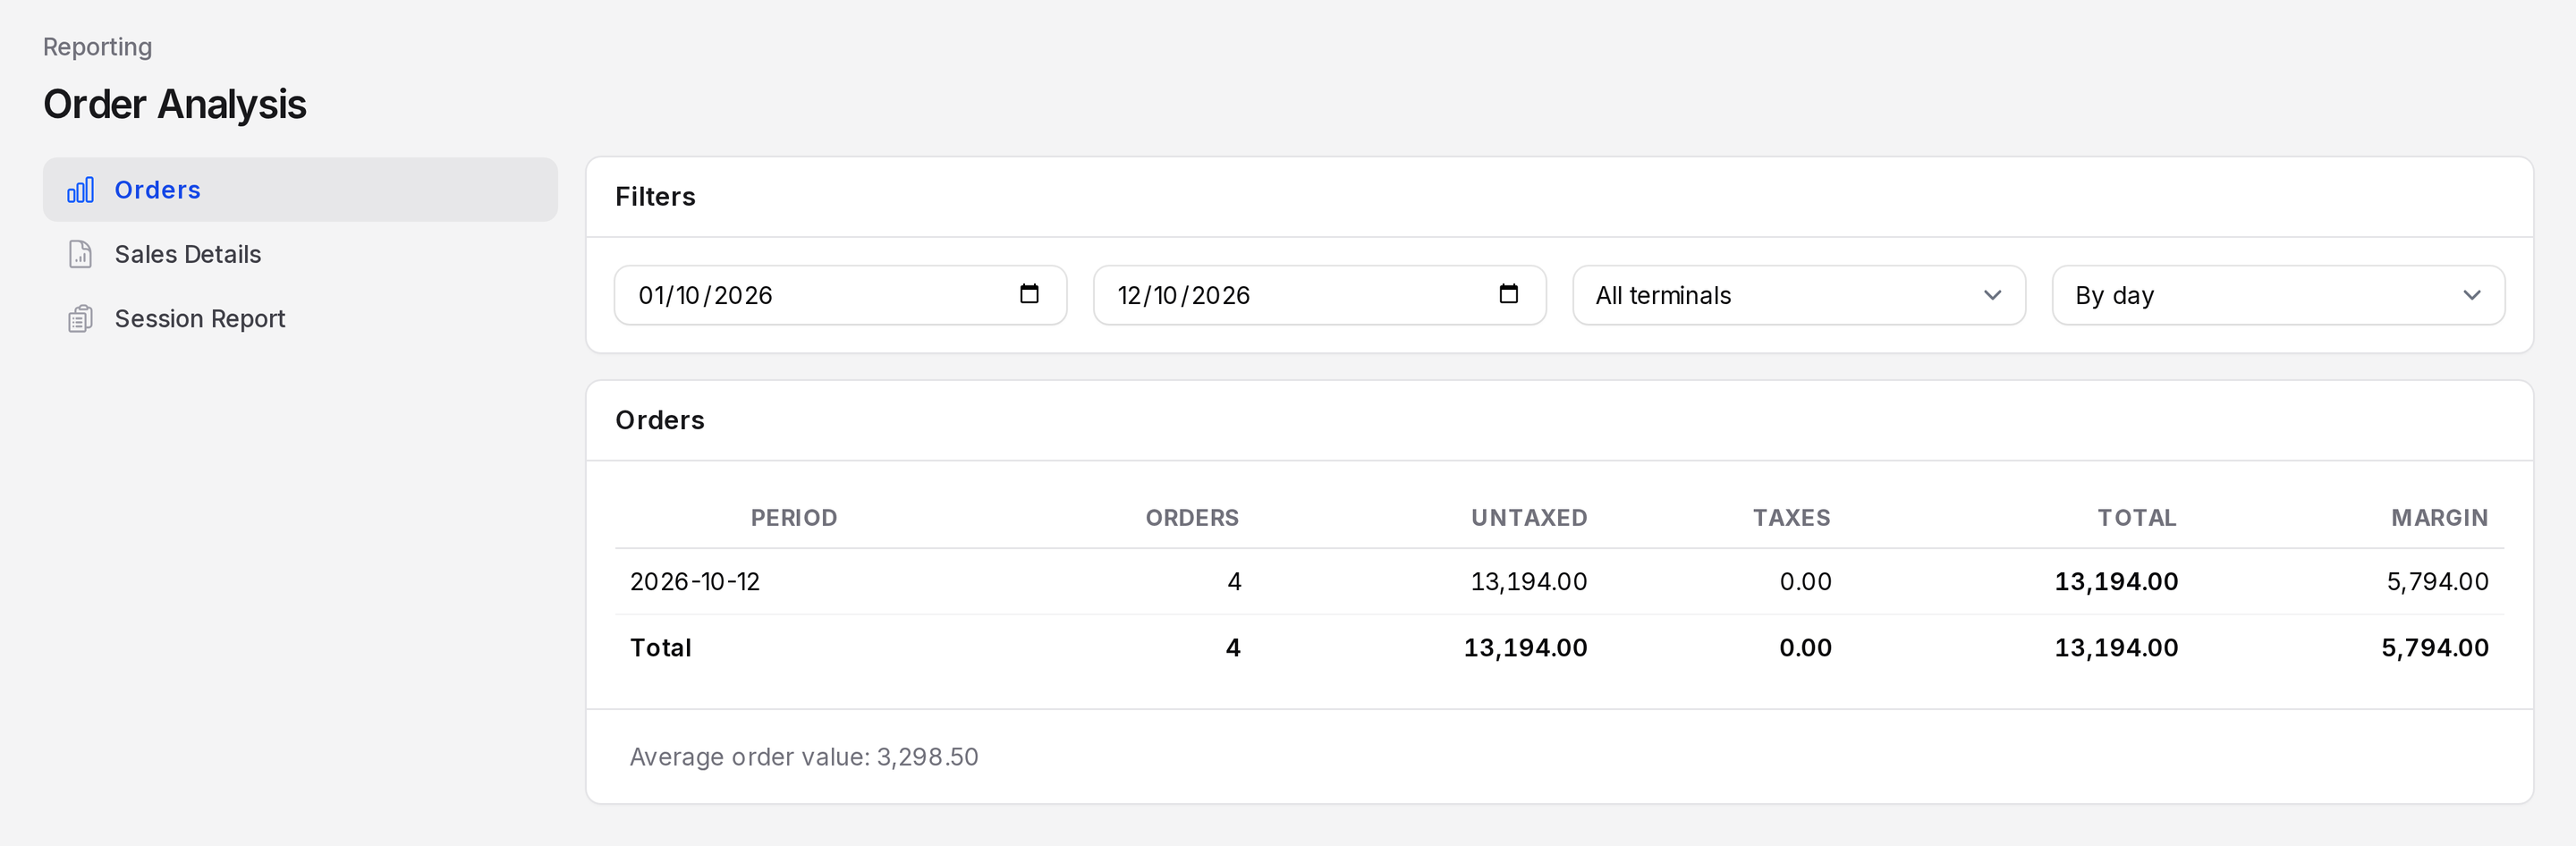
Set the filters
The filter bar has four fields, from left to right.
- Start date: The first day to include. It starts on the first day of the current month.
- End date: The last day to include. It starts on today.
- Terminal: Choose All terminals or one register, for example TechNest Electronics.
- Grouping: Choose By day, By week or By month.
The table refreshes as soon as you change a field.

Read the table
Each row is one period. The columns are:
- Period: The day (2026-10-12), the ISO week (2026-W42) or the month (2026-10).
- Orders: How many settled orders fall in this period.
- Untaxed: The sum of order amounts before tax.
- Taxes: The sum of tax on those orders.
- Total: Untaxed plus taxes.
- Margin: The profit margin of the orders, added up for the period.
The last row, Total, adds up every column. Below the table you see Average order value, which is the total divided by the number of orders.
INFO
Only orders with status Paid, Posted or Invoiced are counted. Refund orders count too, with negative amounts.
Worked example
Take the sample data, all created on 12 October 2026, with All terminals and By day.
| Period | Orders | Untaxed | Taxes | Total | Margin |
|---|---|---|---|---|---|
| 2026-10-12 | 3 | 6,597.00 | 0.00 | 6,597.00 | 2,897.00 |
| Total | 3 | 6,597.00 | 0.00 | 6,597.00 | 2,897.00 |
The three orders are TNE/00001, TNE/00002 and the refund of TNE/00002. The smartphone sale and its refund cancel each other. The average order value is 6,597.00 divided by 3, which is 2,199.00.
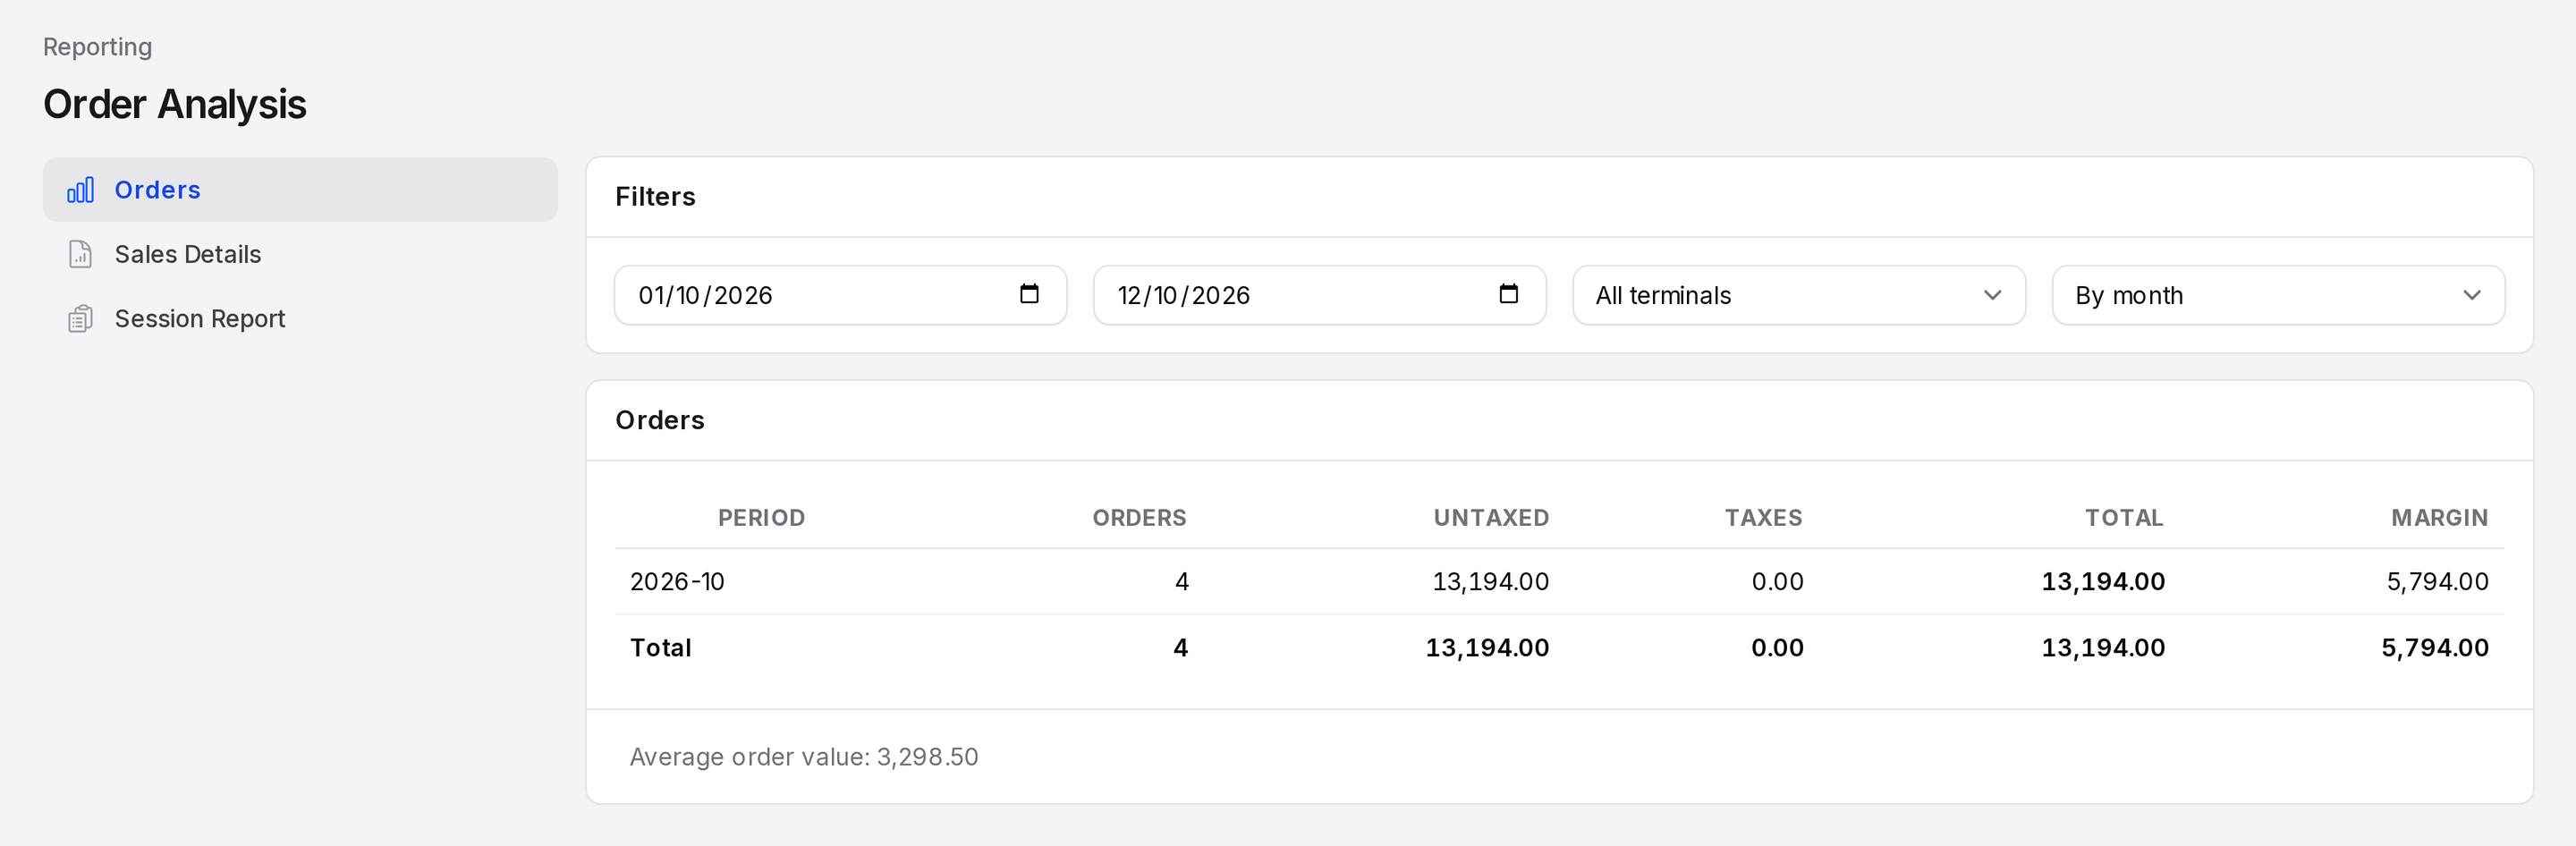
Switch By day to By month. The table shows one row, 2026-10, with the same numbers.
Common questions
Why is my order missing? Check its status. A New or Cancelled order is not counted. Also check that the order date is inside the range.
Why is the count higher than the number of sales I made? Each refund is an order. One sale plus one refund counts as two.
Can I see which products were sold? Yes. Use Sales details for products, payments and taxes.