

CRM reporting
Reporting turns your leads, opportunities and finished activities into numbers you can read and compare. You use it to plan revenue, find where deals stall, and check how busy your team is. All four reports share the same layout and controls, so you learn them once.
In simple words: A report groups your records, adds up one number for each group, and shows the result as a list or a chart.
Open CRM → Reporting. The menu holds four pages.
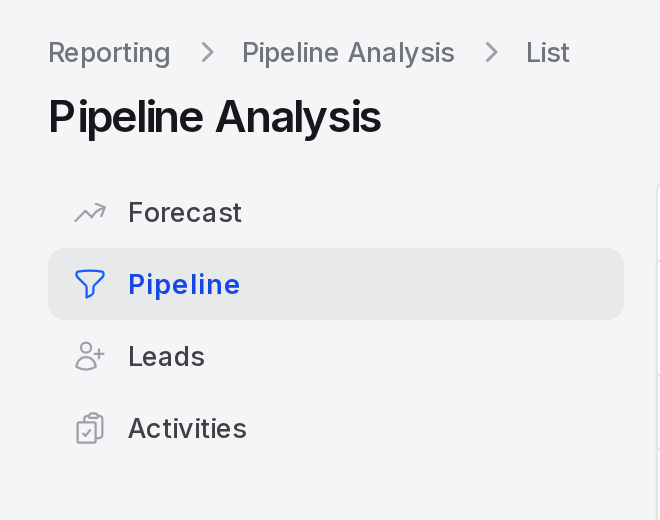
Pages in this group
| Page | Built on | Views | Default measure | Default group by |
|---|---|---|---|---|
| Forecast | Opportunities | Board, List, Graph | Prorated Revenue | Expected Closing |
| Pipeline analysis | Opportunities | List, Graph | Expected Revenue | Stage |
| Lead analysis | Leads and opportunities | List, Graph | Count | Creation Date |
| Activity analysis | Finished activities | List, Graph | Count | Completion Date |
Which report to use
| Question | Report |
|---|---|
| How much revenue should we expect each month? | Forecast |
| Where do my open deals sit, and what are they worth? | Pipeline analysis |
| How many leads came in, and how many did we win or lose? | Lead analysis |
| Which follow-ups did the team finish? | Activity analysis |
How every report works
Each report page has the same parts.
- View switch: Change between List and Graph. Forecast also has Board.
- Tabs: Ready-made views of the data, such as Open, Won or Lost.
- Group by: Choose the field that makes the groups, for example Stage or Salesperson.
- Measure: Choose the number to calculate for each group, for example Expected Revenue.
- Split by: Graph only. It cuts every bar into coloured parts by a second field.
- Filters and search: Narrow the records. Every report has Salespeople and Sales Teams filters.
Measures
A measure is the number a report calculates. The sales reports share six measures.
| Measure | What it calculates |
|---|---|
| Count | The number of records. |
| Expected Revenue | The sum of Expected Revenue on the records. |
| Prorated Revenue | The sum of expected revenue times probability. A 100,000 deal at 40% adds 40,000. |
| Probability (avg.) | The average of Probability, shown as a percentage. |
| Days to Assign | The average number of days from creation to the day a salesperson was assigned. |
| Days to Close | The average number of days from creation to the closed date. |
Activity analysis has only Count.
The List view
The list shows one row per record and an extra column for the measure you picked. At the bottom, a summary row adds up the measure for all rows. Pick a Group by and the rows fold into groups with a subtotal each.
The Graph view
The graph is a bar chart. Its title reads "measure by group", for example Expected Revenue by Stage. Choose Measure and Split by above the chart. When you split, the bars are stacked.
TIP
The numbers depend on your data. Keep Expected Revenue, Probability and Expected Closing filled in on every opportunity. See Manage opportunities.
Behind the scenes
- Reports only read data. Opening or changing a view never edits a record.
- Forecast, Pipeline and Lead analysis read the same lead and opportunity records you see in the pipeline.
- Activity analysis reads a log that Aureus writes each time an activity on a lead or opportunity is marked done.
- Amounts show in the currency of your company.