

Pipeline analysis
Pipeline analysis lets you slice your opportunities by any field and add up one number for each slice. You use it to see how much money sits in each stage, which salesperson carries the most deals, and how long deals take to be assigned and closed.
In simple words: Pick how to group your opportunities, pick what to add up, and read the result as a list or a chart.
Open CRM → Reporting → Pipeline. The page title is Pipeline Analysis.
The report page
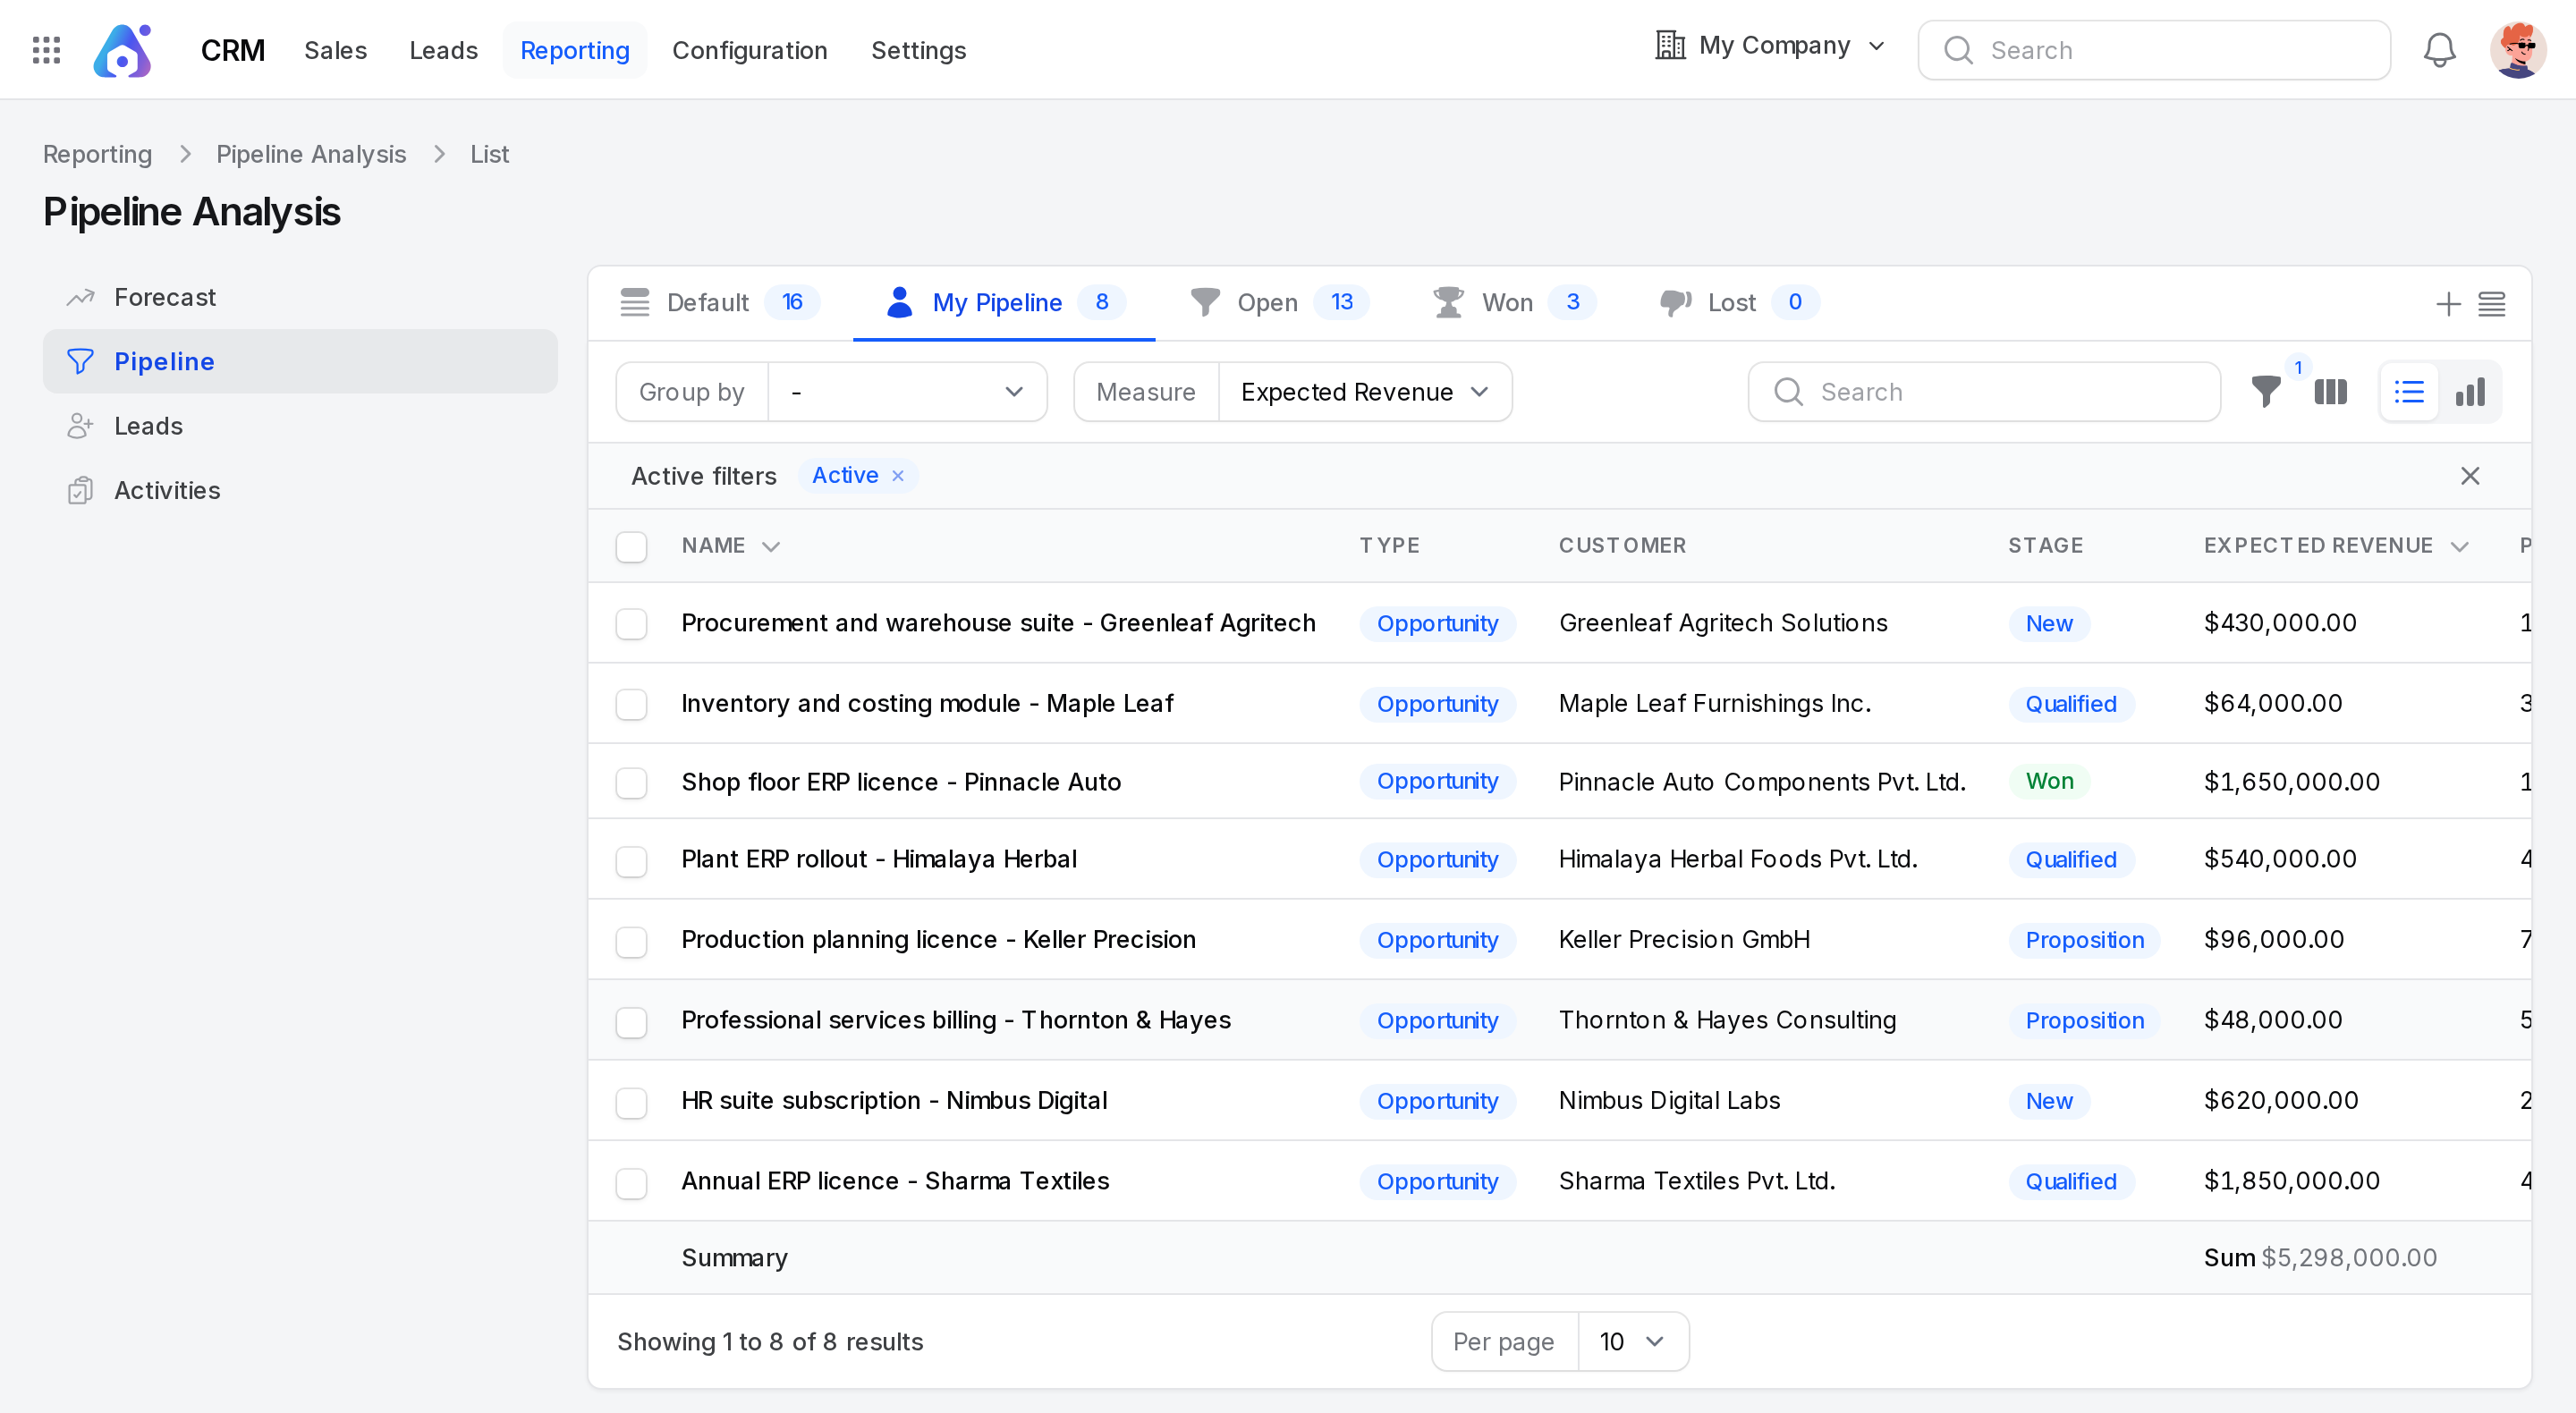
The page has two views: List and Graph. Use the view switch to change between them.
Views (tabs)
- Default: All opportunities that match the filters.
- My Pipeline: Opportunities where you are the salesperson.
- Open: Opportunities that are not in a won stage.
- Won: Opportunities in a won stage.
- Lost: Opportunities you marked as lost.
Open the tab menu for Unassigned, the opportunities with no salesperson.
Default filter
The report starts with the rule Active. It hides lost opportunities from the default list. Remove the rule to include them. Use the Lost tab to see only lost deals.
Columns
Name, Type, Customer, Stage, Expected Revenue, Probability, Salesperson, Sales Team, Expected Closing, Created On and Closed On. Use the column toggle to add Lost Reason, Country and City. The last column shows the measure you chose. A summary row adds it up.
Search, filter, group and export
- Type in the search box to find an opportunity.
- Use the Salespeople and Sales Teams filters.
- Use the filter builder for rules on Salesperson, Active, Won, Closed Date and other fields.
- Click a row to open the opportunity.
- Select rows, then export them or run a bulk action such as mark as lost, merge, or send email or SMS.
Group by
Group by folds the rows into groups. Each group shows a subtotal of the measure. The options are:
- Salesperson, Sales Team, Stage
- City, Country, Company
- Lost Reason
- Campaign, Medium, Source
- Expected Closing, Creation Date, Conversion Date, Closed Date (grouped by month)
The graph groups by Stage at first.
Measure
Use Measure to choose the number the report adds up. The measure is shown as an extra column in the list and as the bar height in the graph.
| Measure | True meaning |
|---|---|
| Count | How many opportunities are in the group. |
| Expected Revenue | The sum of Expected Revenue. This is the default. |
| Prorated Revenue | The sum of expected revenue times probability divided by 100. |
| Probability (avg.) | The average Probability of the group, shown as a percentage. |
| Days to Assign | The average days between creation and the date a salesperson was assigned. |
| Days to Close | The average days between creation and the closed date. |
The Graph view
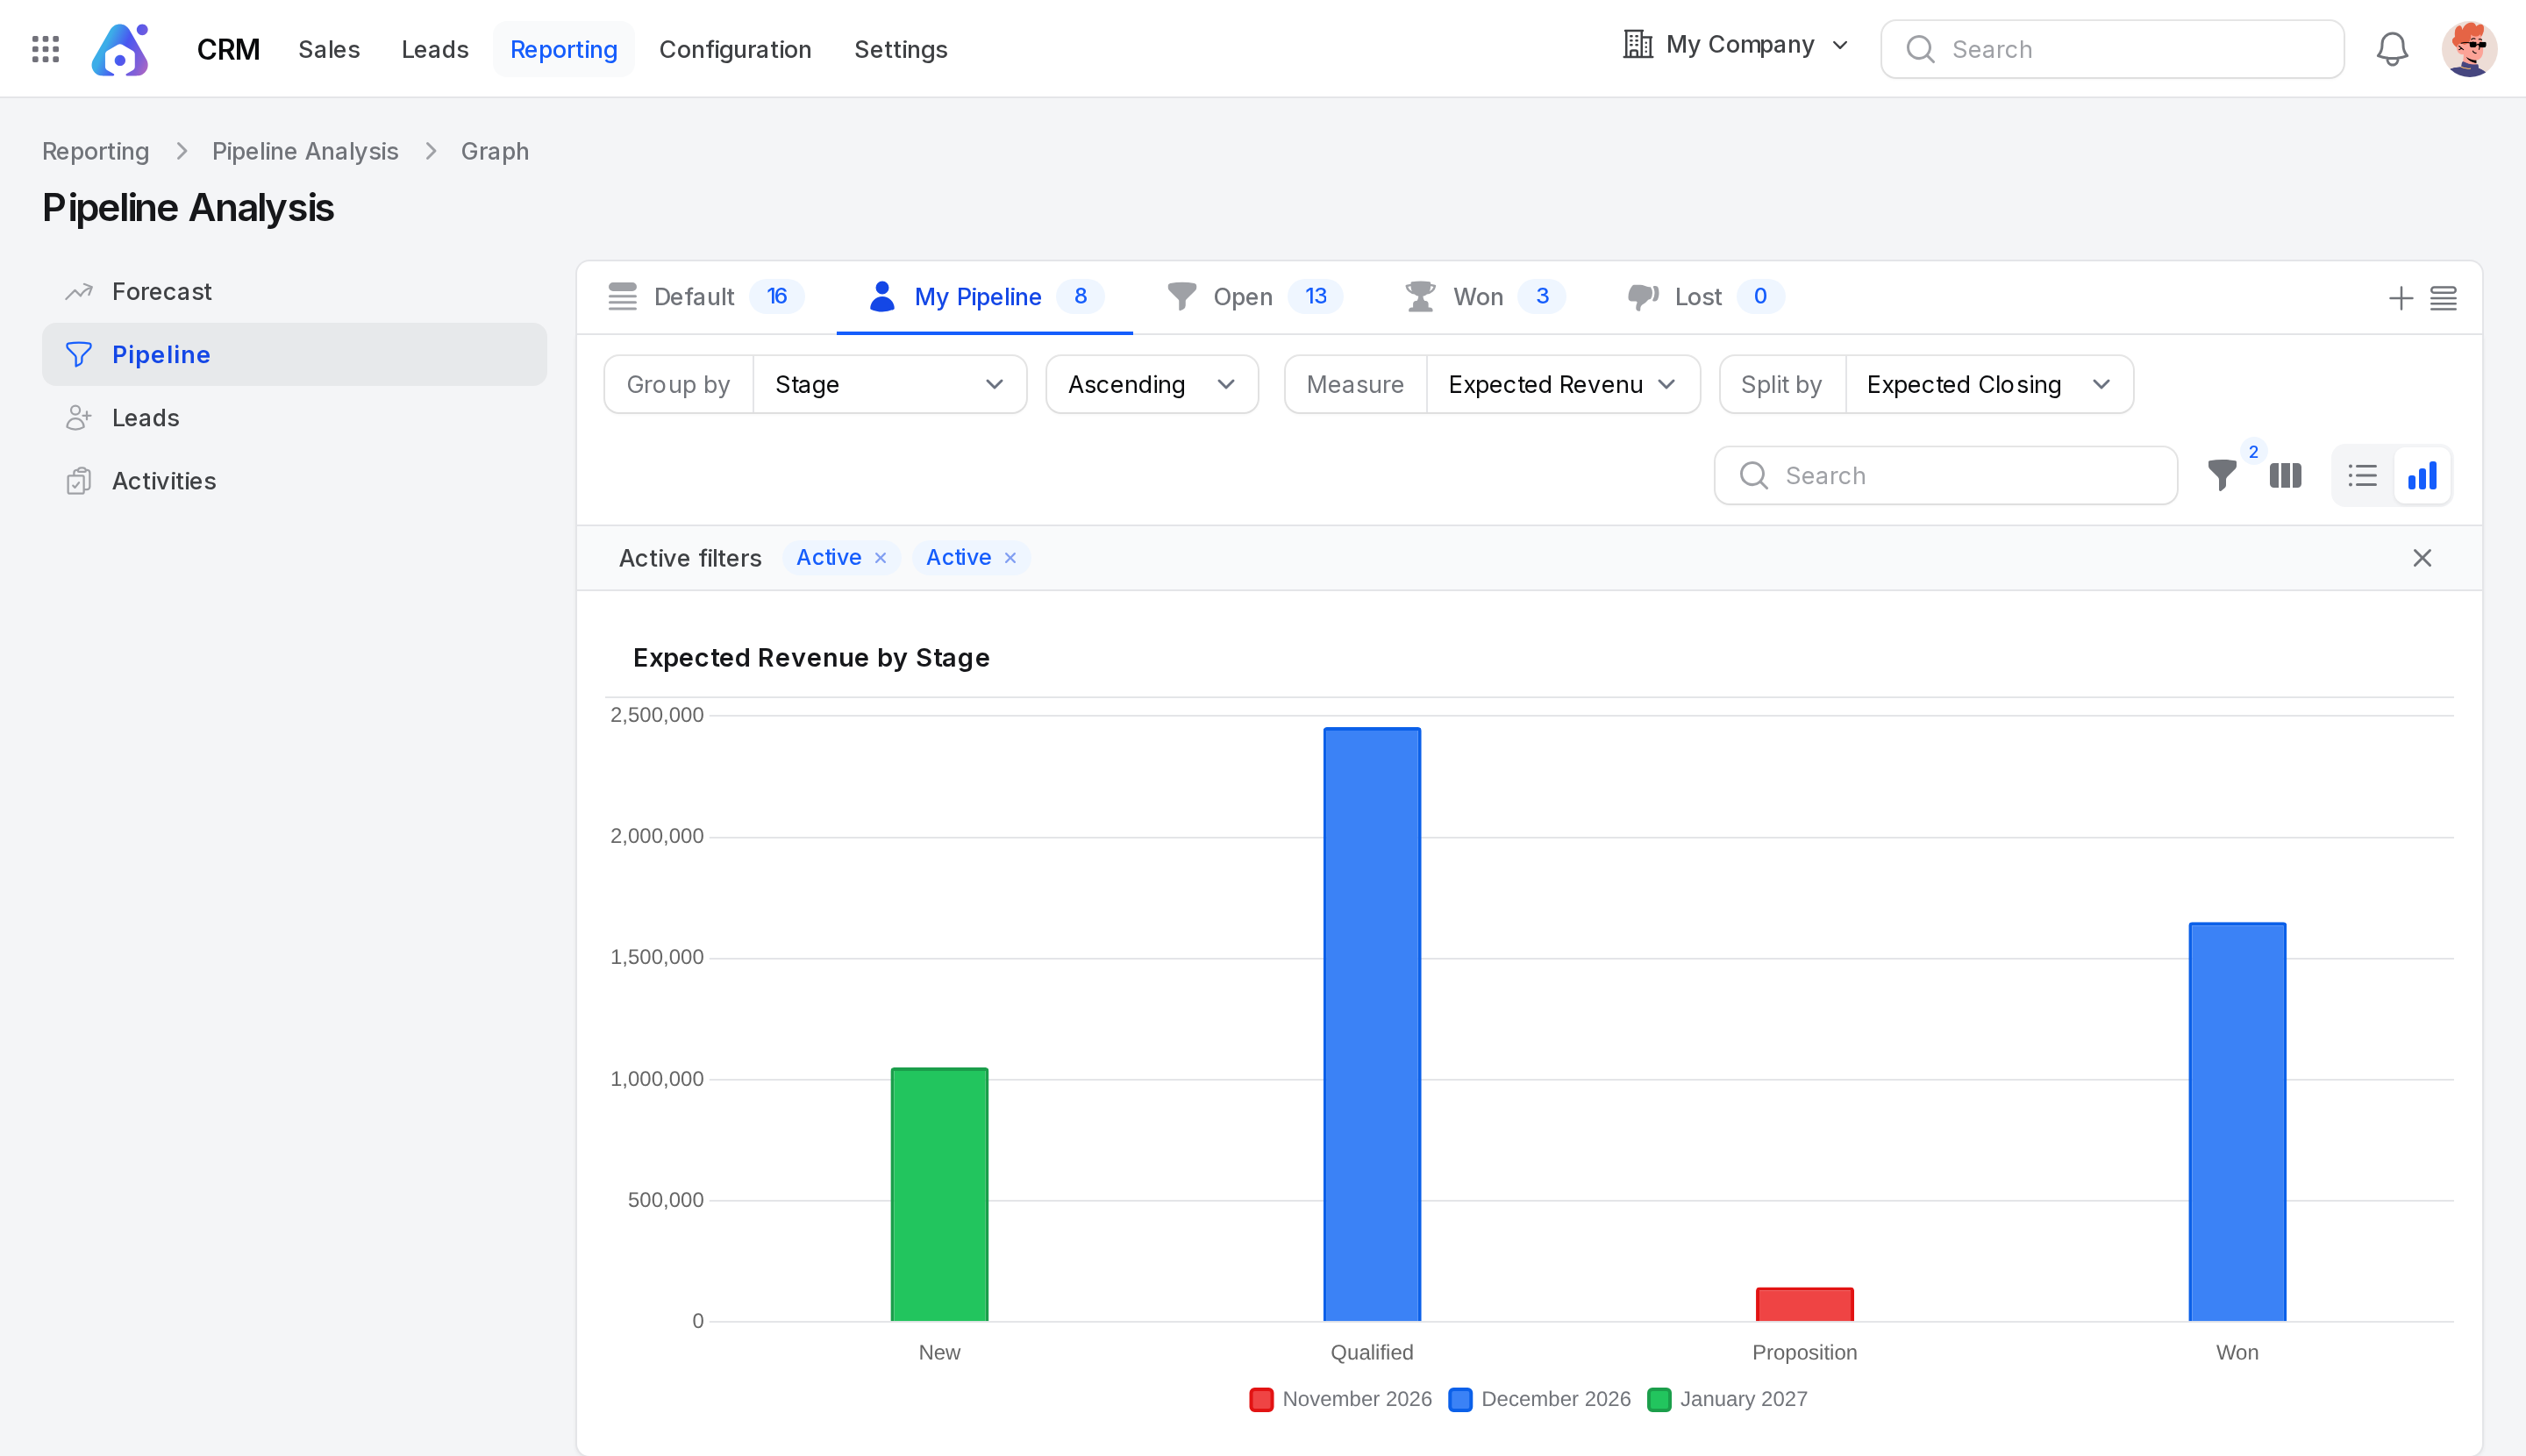
- Click Graph in the view switch.
- Choose a Measure, for example Expected Revenue.
- Choose Group by to set the bars. The title shows both, for example Expected Revenue by Stage.
- Choose Split by to cut each bar by a second field. The default split is Expected Closing. Choose No split for plain bars.
Read the report
Example: In the list, the Active rule leaves four opportunities with a summary of $2,614,000.00 expected revenue.
- Set Group by to Stage.
- Proposition holds two deals: $96,000 and $48,000. Its Expected Revenue subtotal is $144,000.
- Change Measure to Prorated Revenue. Proposition drops to $93,600, because the deals are at 70% and 55%.
- Change Measure to Probability (avg.). Proposition shows 62.5%.
The first two stages tell you how large the pipeline is. The last tells you how sure you are of it.
TIP
To find slow handling, group by Salesperson and use Days to Assign. A high number means leads wait before someone takes them.
Behind the scenes
- The report reads opportunities only. A lead appears here after you convert it.
- Days to Close counts only opportunities that have a closed date. Days to Assign counts only those that were assigned.
- Lost opportunities stay in the data. They show with the stage label Lost.
- Nothing you change on this page edits a record.